In this virtual lab, we had the ability to step into the shoes of a medical intern, testing three different patients who believed they might have a heart condition. To confirm/deny their suspicions, each patient was put through three analysis examinations: stethoscopic, echocardiographic, and MRI. Their pedigrees were also analyzed to determine whether or not, if they did have a heart condition, the condition was dominate or recessive. As we went through the online lab, a series of reference photos were given to demonstrate what a normal heart should look and sound like during these tests; these were beneficial in the process of determining whether or not the patient had a condition, and what, specifically, might be the issue.


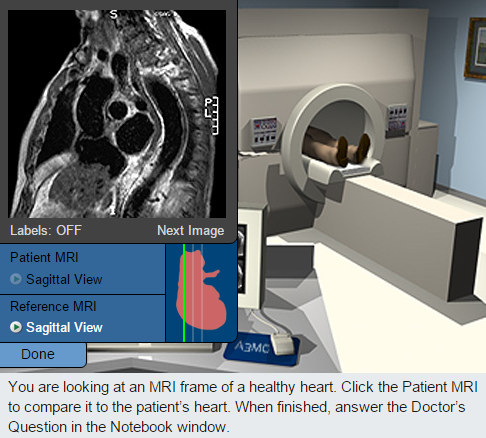
The next test performed was an MRI exam. After comparing the test results to the reference MRI, it became clear that the patient was suffering from a dilated aorta, which is a form of an aortic aneurysm.

As the patient mentioned earlier, their sibling died of heart related causes. After evaluating patient A, we reviewed his pedigree to determine whether or not the condition was inheritable, and whether or not any other family members were at risk.


The next test was the echocardiographic exam. The results showed a very distinct issue: the patent was missing the wall between the left and right atria, a severe form of an atrial septal defect. This condition could lead to a flooding of blood in the lungs as well as an imbalance of pressure in the heart.

The patient's pedigree was then examined, and it was found that the condition could be inherited through a recessive gene.


Reference Photos
Patient A
The first patient we examined was patient A, a 30 year old male of tall stature and light weight. His records can be seen below.

After reviewing patient A's file, he was taken into the stethoscopic room for an exam.

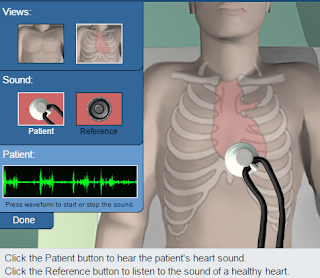
After conducting the exam, we were able to compare the patient's heart sound to the healthy reference heart sound, and we found them to be very different. The healthy heart had a very distinct and separated sound while the patient's sound was more warbled, blending together in some places and delayed in others. This sound indicated a systolic murmur, and the patient was encouraged to undergo more testing.
The next test performed was an echocardiographic exam, in which it was concluded that the patient's aorta was increased in size, indicating the presence of an aneurysm. The results showed that further testing would be required.

The next test performed was an MRI exam. After comparing the test results to the reference MRI, it became clear that the patient was suffering from a dilated aorta, which is a form of an aortic aneurysm.

As the patient mentioned earlier, their sibling died of heart related causes. After evaluating patient A, we reviewed his pedigree to determine whether or not the condition was inheritable, and whether or not any other family members were at risk.
A quick evaluation of the pedigree confirmed that there was a dominant pattern of inheritance.

All of the results from the tests and examinations were considered, leading to a diagnosis of Marfan Syndrome.


Patient B
The next patient examined was a 35 year old male, with a dwarfic condition.

Just like with patient A, patient B's examination began with a stethoscopic test. Again, the sound heard was abnormal, with the "lub" and "dub" being heard as multiple short sounds than singular, distinct noises.

The next test was the echocardiographic exam. The results showed a very distinct issue: the patent was missing the wall between the left and right atria, a severe form of an atrial septal defect. This condition could lead to a flooding of blood in the lungs as well as an imbalance of pressure in the heart.

The results from the patient examination lead to a conclusive diagnosis of Ellis-van Creveld (ECV) syndrome. This condition is a rare and recessive gene characterized by atrial septal defects as well as dwarfism, which are both seen in the patient.
Patient C
The last patient examined was a 55 year old male of normal build.

To gain an understanding of the patient's condition, a stethescopic exam was conducted. A murmur could be heard between the second and first sound, which prompted further testing.

The next test was the echocardiograph. A comparison between the echocardiograph and the reference echocardiograph indicated that the patient had a thickened leaflet in the mitral valve, causing it to move slowly and poorly. This has led to an obstruction between the left atrium and left ventricle; the patient is suffering from a condition known as mitral stenosis. Since the condition has been identified, it is not necessary to take an MRI exam, however, the pedigree still needs to be evaluated.


Since only members of the patient's generation have the condition, it is likely not inherited dominantly, and since there are so many people with the condition, it is most likely not inherited recessively either. It is most likely that this condition is a result of environmental factors.
Here is some more information on mitral stenosis and how it relates to the patient: